How do I customize and manage my DOM trading?
Customize by accessing the DOM Settings Menu.
Orders & Positions Management
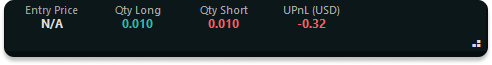
Positions Bar
The Positions Bar gives a summary of your current positions for the selected instrument, helping you manage your Positions.
What information is shown in the Positions Bar in One-Way Mode?
In One-Way Mode, the Positions Bar displays your Entry Price, Quantity, Unrealized Profit and Loss (UPnL) in user currency, and Liquidation Price.

What information is shown in the Positions Bar in Hedge Mode?
In Hedge Mode, for single positions, the Positions Bar shows your Entry Price, Quantity Long, Quantity Short, and Nett UPnL in user currency.
When you have multiple positions the Positions Bar shows Quantity Long, Quantity Short, and Nett UPnL in user currency.
Additional Functions & Metrics
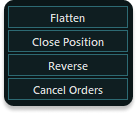
What is the Flatten function?
The Flatten function closes all open positions and cancels any orders for the selected Instrument, providing an easy way to exit the market quickly.
What does the Close function do?
The Close function closes all your open positions for the selected Instrument, effectively taking you out of the market.
How does the Reverse function work?
The Reverse function takes your current positions for the selected Instrument and flips them to the opposite direction. For example, if you have a Long position, it will switch to Short.
What does the Cancel Orders button do?
The Cancel Orders button cancels all open orders for the selected Instrument that have not yet been filled.
User Account Instrument Information
This feature provides key information about your trading account and the instruments you're trading. You are able to adjust your Trade Settings by clicking on values in this section, where applicable.

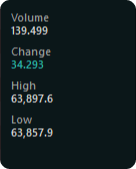
Instrument Session Metadata
Instrument Session Metadata provides real-time data about the trading session, including:
- Volume: The total volume traded within a rolling volume period.
- Change: The net difference between buys and sells during the rolling volume period.
- High: The highest price reached during the session.
- Low: The lowest price reached during the session.
DOM Settings Menu
The DOM Settings Menu provides customizable options that allow you to tailor the DOM Trader interface to your trading preferences. You can access various features like locking the view to the mid-price, adjusting display settings, and toggling visibility of different data points.
Taskbar Icons
What does the Padlock icon do?
- The Padlock icon locks the view to the mid-price, ensuring that the price levels displayed are centered around the market's mid-price. This feature is also accessible in the DOM Settings.
What is the Gear icon used for?
- The Gear icon opens the DOM Settings Menu, where you can configure various aspects of the DOM Trader panel, such as display options and data visibility.
What happens when I click the Panel icon?
- The Panel icon allows you to hide or show the side panel of the DOM Trader interface, giving you control over the layout and space allocation on your screen.
DOM Settings Menu Options
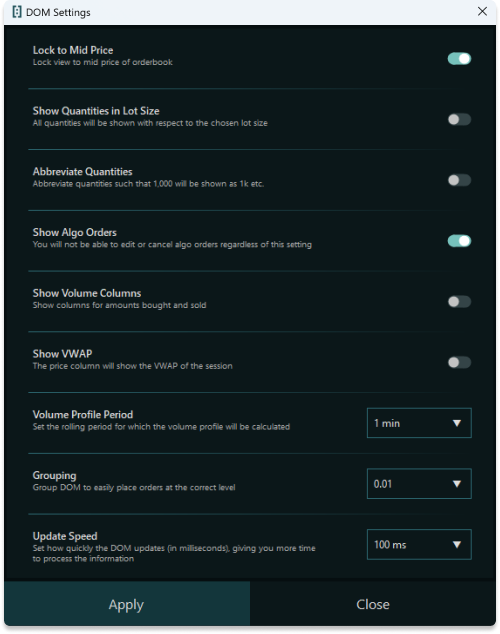
What does the "Lock to Mid Price" option do?
- The "Lock to Mid Price" option locks the view of the DOM Trader panel to the market's mid-price, helping you focus on price levels that are central to the current trading range.
What does "Show Quantities" refer to?
- "Show Quantities" adjusts how quantities are displayed in the DOM Trader, aligning them with the chosen lot size, making it easier to interpret the data relative to your trading strategy.
What does "Abbreviated Quantities" mean?
- "Abbreviated Quantities" reduces the number of digits for all orders' quantities in the DOM, making the interface cleaner and easier to read, especially in markets with larger order sizes.
What are Algo Orders?
- The "Algo Orders" option allows you to view Sandwich Algo orders in the DOM Trader, along with orders placed directly in the DOM.
What do the Volume Columns display?
- The Volume Columns show the amount of assets bought and sold at each price level. You can toggle this feature on or off depending on whether you want to see this data.
What is VWAP and how is it used?
- VWAP (Volume-Weighted Average Price) displays the average price at which the instrument has traded during the session, weighted by volume.
What does the "Volume Profile Period" setting do?
- The "Volume Profile Period" setting adjusts the session duration, affecting how the rolling volume metrics displayed in the DOM Trader are calculated.
What is Grouping in the context of the DOM Trader?
- Grouping aggregates orders into groups based on their price levels, simplifying the order book and making it easier to analyze market depth.